
We Spent $3,113 on Demand Gen Across Five Accounts and Got Four Leads.
Five home-service accounts spent $3,113 on Google Demand Gen in 30 days and booked four leads. That is $779 per lead against a $125.70 book average.
March 23, 2021
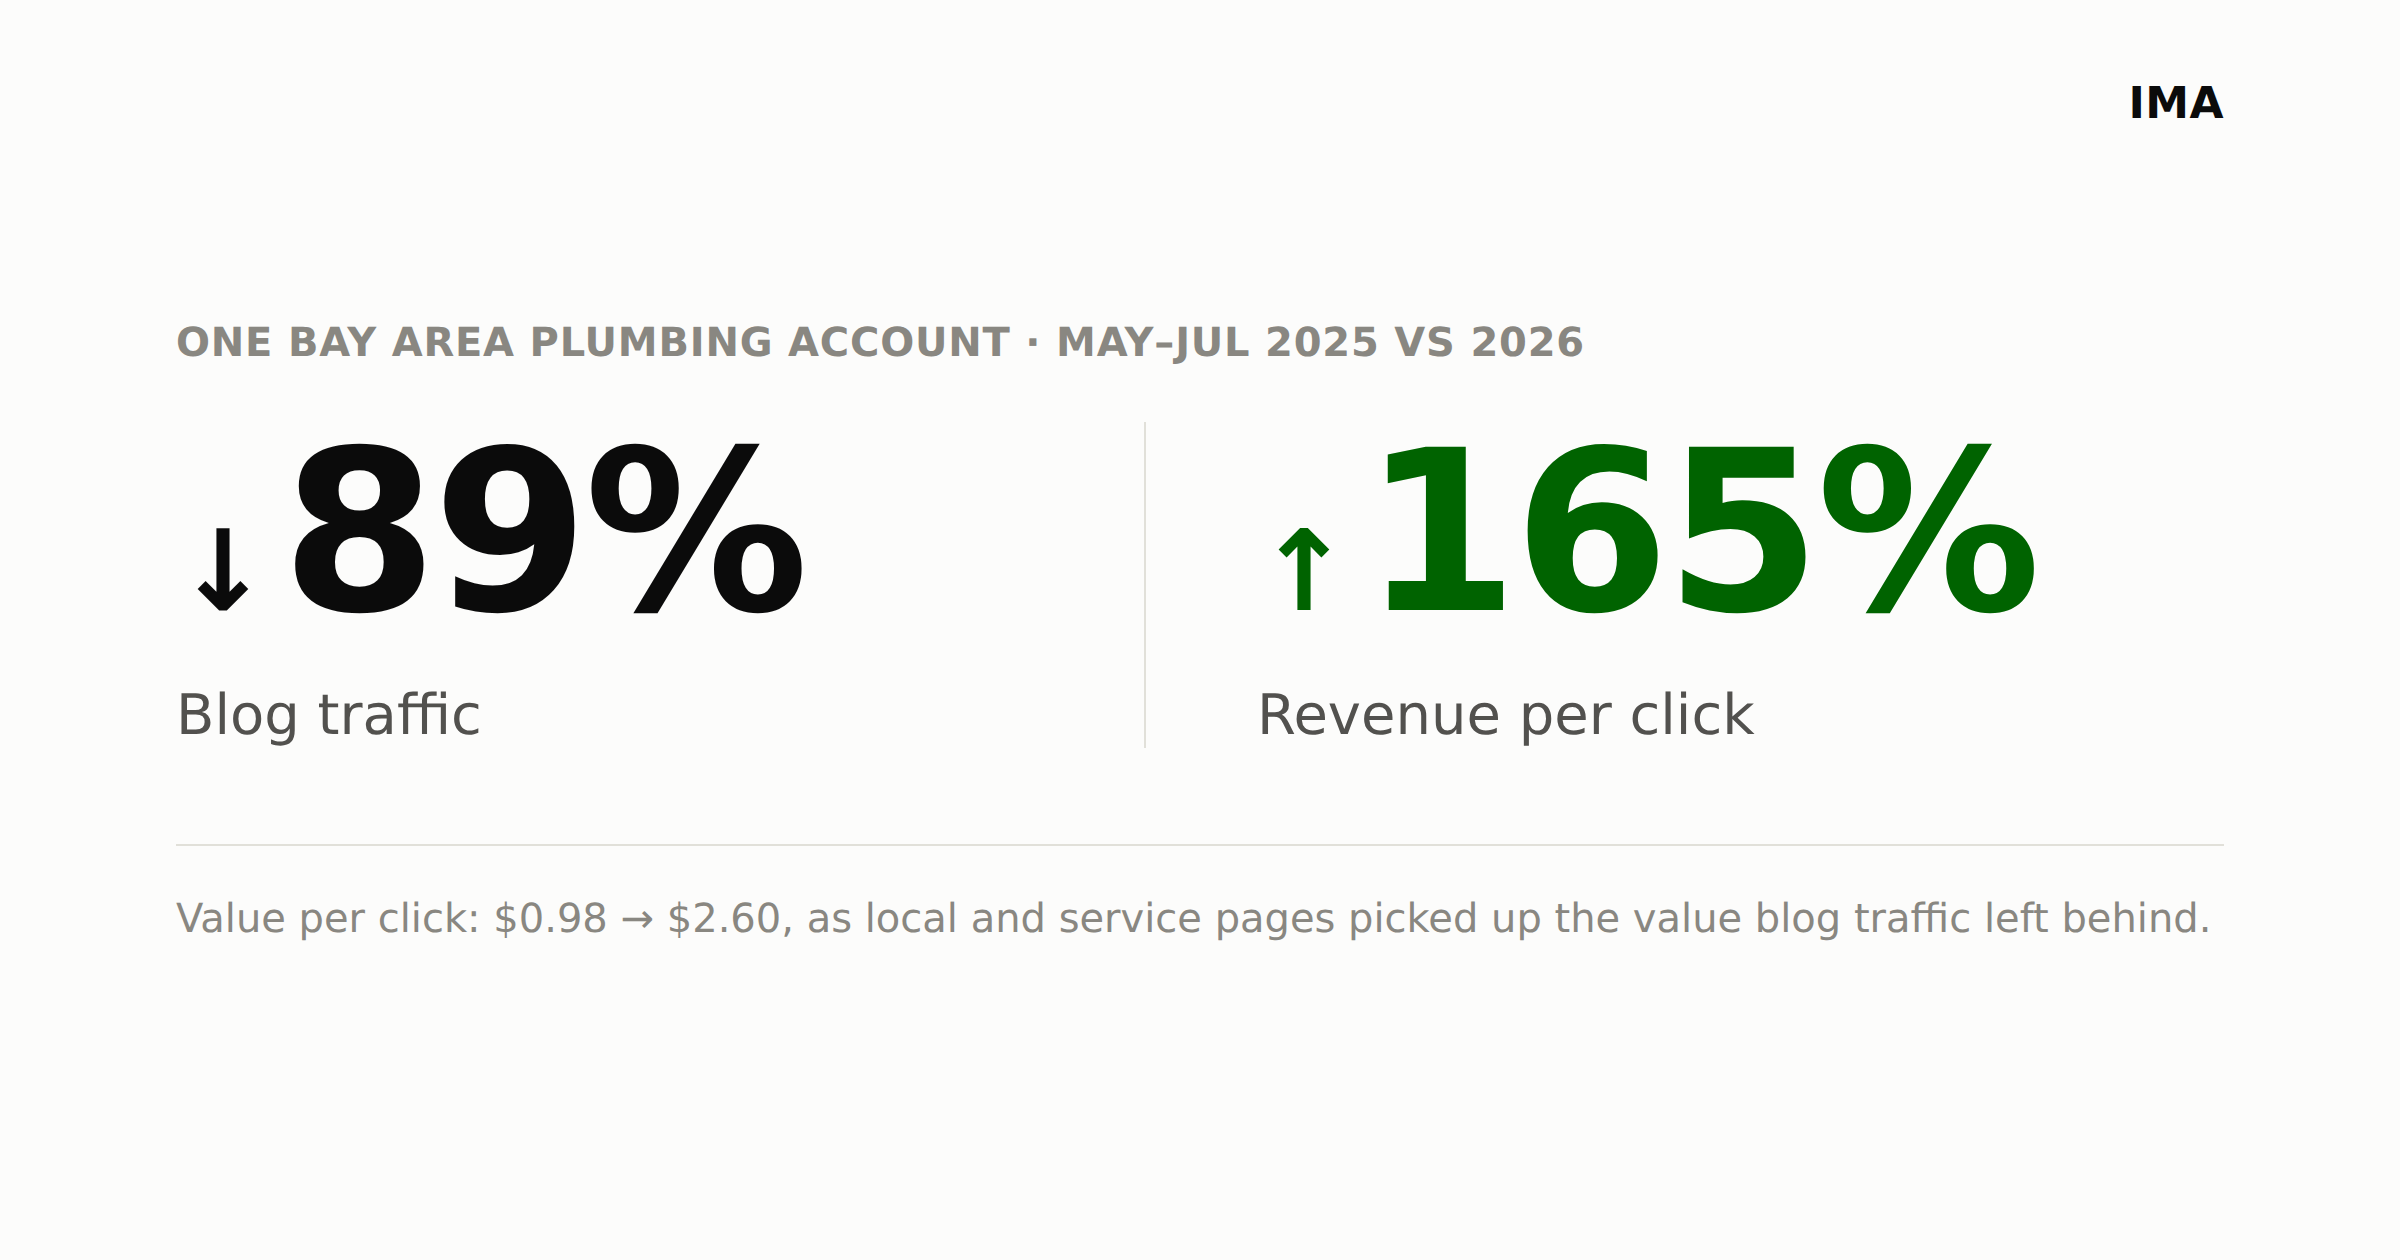
AI cut blog traffic to a Bay Area plumbing client by 89%. Revenue per click still rose 165% once local and service pages picked up the slack.

One of our plumbing clients lost 89% of the clicks going to its blog over the past year. In the same period, the revenue value of every click on the site went up 165%.
Both of those are true at the same time, on the same site. Once you see why, it changes how you should read your own traffic reports.
I had our SEO team pull Google Search Console data for this client's top 100 pages by clicks, in two windows: May through July 2025, and May through July 2026. Same three months, one year apart, so the comparison isn't skewed by a seasonal swing.
We sorted the pages into three buckets. Blog posts, meaning informational content that answers a question like "why is my water brown." Local and service pages, meaning the city pages and service pages built to catch someone searching "plumber near me" or "plumber in [city]." And a small bucket of brand and conversion pages: the homepage, the appointment page, the contact page.
The dollar figures come from Ahrefs' estimated traffic value for each page, which models what that click would have cost as a paid search click given its keyword and position. It's an estimate, not the client's actual revenue. But it's a consistent estimate applied the same way in both windows, which is what makes the before-and-after comparison useful even though the absolute dollar figures are modeled rather than measured.
This is one account, not the whole book. I'm publishing it because the shift is large and it matches a pattern we're starting to see show up, in a smaller way, across other home service clients. If you run a services business with any kind of blog, this is worth checking on your own site before you assume your traffic report is telling you the whole story.
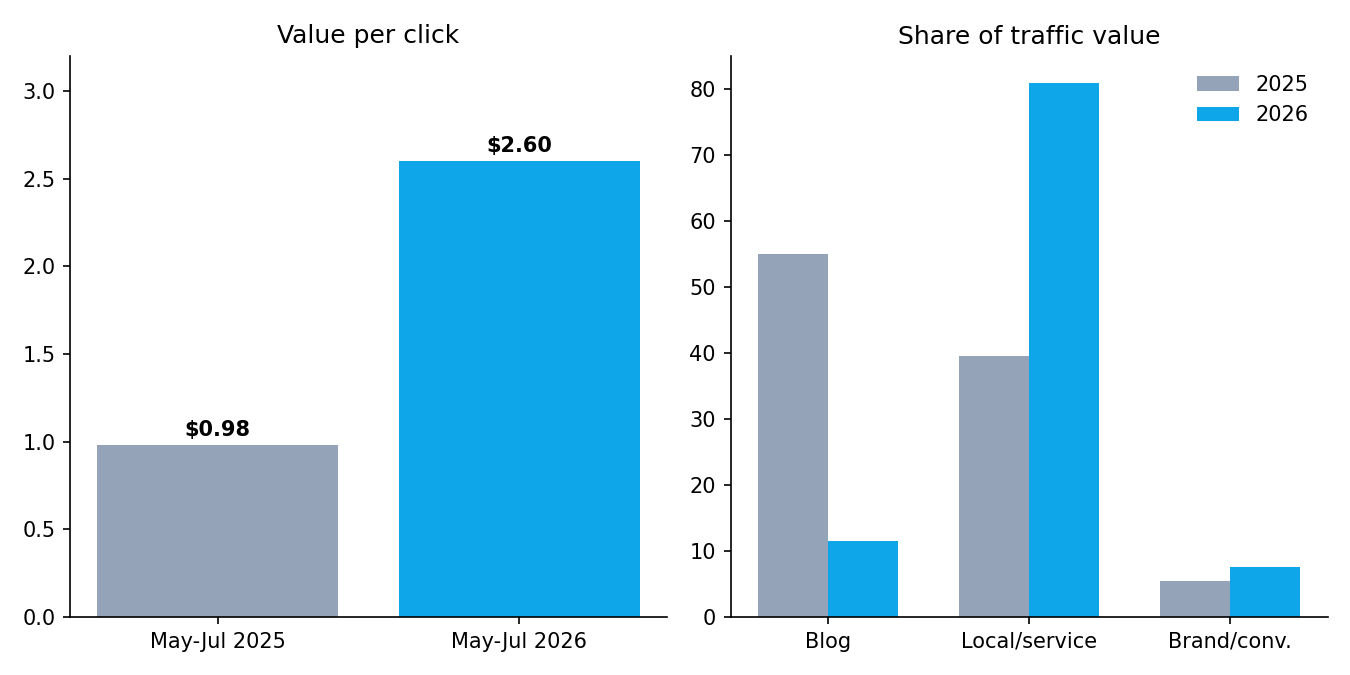
MetricMay–Jul 2025May–Jul 2026ChangeBlog clicks5,406578-89%Local/service page clicks302216-28%Total clicks (top 100 pages)5,776826-86%Total estimated traffic value$5,667$2,147-62%Value per click$0.98$2.60+165%
The value split moved even harder than the clicks did:
Share of total traffic value20252026Blog pages55.0%11.5%Local/service pages39.5%81.0%Brand/conversion pages5.5%7.5%
A year ago, blog content carried most of this site's traffic and about half its estimated value. Now it's a tenth of the value, and local and service pages carry four out of every five dollars.
It's actually pretty simple once you separate the two kinds of searches happening here.
A search like "why is my water brown" is a question. Google, ChatGPT, and every other AI answer engine can now answer that question directly, on the results page or inside a chat window, without sending anyone to a blog post. The searcher gets their answer and moves on. That traffic doesn't come back because there's nothing left to click for.
A search like "plumber in Concord" is not a question. It's a decision. Nobody asks an AI chatbot to find them a plumber at 11pm with a leaking pipe and then waits around for a conversational answer. That search still runs through Google or Maps, and it still ends in a call. AI answer engines have not found a way to insert themselves into "I need someone to show up at my house today," and I don't think they will anytime soon.
That's why blog clicks collapsed and local and service page clicks barely moved. And because a click on a local page is worth far more than a click on an informational blog post, the average value of every click on the site went up even as the total number of clicks fell by more than half.
I've sat through enough client calls to know the instinct the traffic report triggers. Sessions are down 86% year over year, so the assumption is that something broke. Rankings dropped, Google penalized the site, the SEO work stopped working. None of that happened here. The pages that pay the bills held their ground. What changed is that the pages that used to generate a lot of low-value curiosity clicks stopped generating them, because the curiosity got satisfied somewhere else before it ever reached the site.
This shift did not improve the client's visibility inside AI answers. We checked. Ranking well on Google's local results and getting cited by an AI Overview or a ChatGPT answer are two different things, built on different mechanics, and this account's local pages rank near the top while getting cited close to zero times by any AI platform. That's a separate problem, and I'll get into it in a future post. Don't read this one as "we won at AI search." We didn't test that here, and the honest answer for this account right now is that we haven't.
The size of the drop is also specific to this account. This client built a large blog over close to a decade, which is exactly the kind of content library that had the most informational search traffic to lose. A site with a dozen blog posts won't see an 89% collapse, because it never had that traffic to begin with. The direction I'd expect to hold broadly: informational traffic down, local-intent share of value up. The magnitude here is closer to a ceiling than an average.
Pull your own Search Console top-pages report and split it the same way: blog versus local and service pages. Most home service sites have never looked at their organic traffic this way. They look at total sessions going up or down and stop there.
If your blog traffic is falling, that alone doesn't tell you whether your organic search is healthy. Check where the value moved. If local and service pages are holding or growing their share, the traffic loss is a symptom of how people search now, not a sign that something is broken on your site.
Stop treating raw traffic as the number that matters. A revenue-weighted view, or even just a lead count by page type, will tell you a truer story than total clicks ever will. Once you can see that split, it's a lot easier to decide where the next content dollar should go: toward more blog posts chasing questions AI can now answer for free, or toward the city and service pages still catching the searches that turn into a job on the calendar.
This is also the conversation I have with clients who want to cut their content budget the moment traffic dips. The instinct is understandable. It's also usually backwards. If a client's local and service pages are the ones holding value, the answer isn't less content investment, it's investment aimed at the pages doing the converting instead of spread evenly across the blog. A quarterly page-type audit, ten minutes in Search Console, is enough to catch this shift before a budget gets cut based on the wrong number.
The next time someone tells you their organic traffic is down and treats it as bad news, ask what kind of traffic it was. In this account, less traffic came with more money attached to it. That's the number that actually matters.
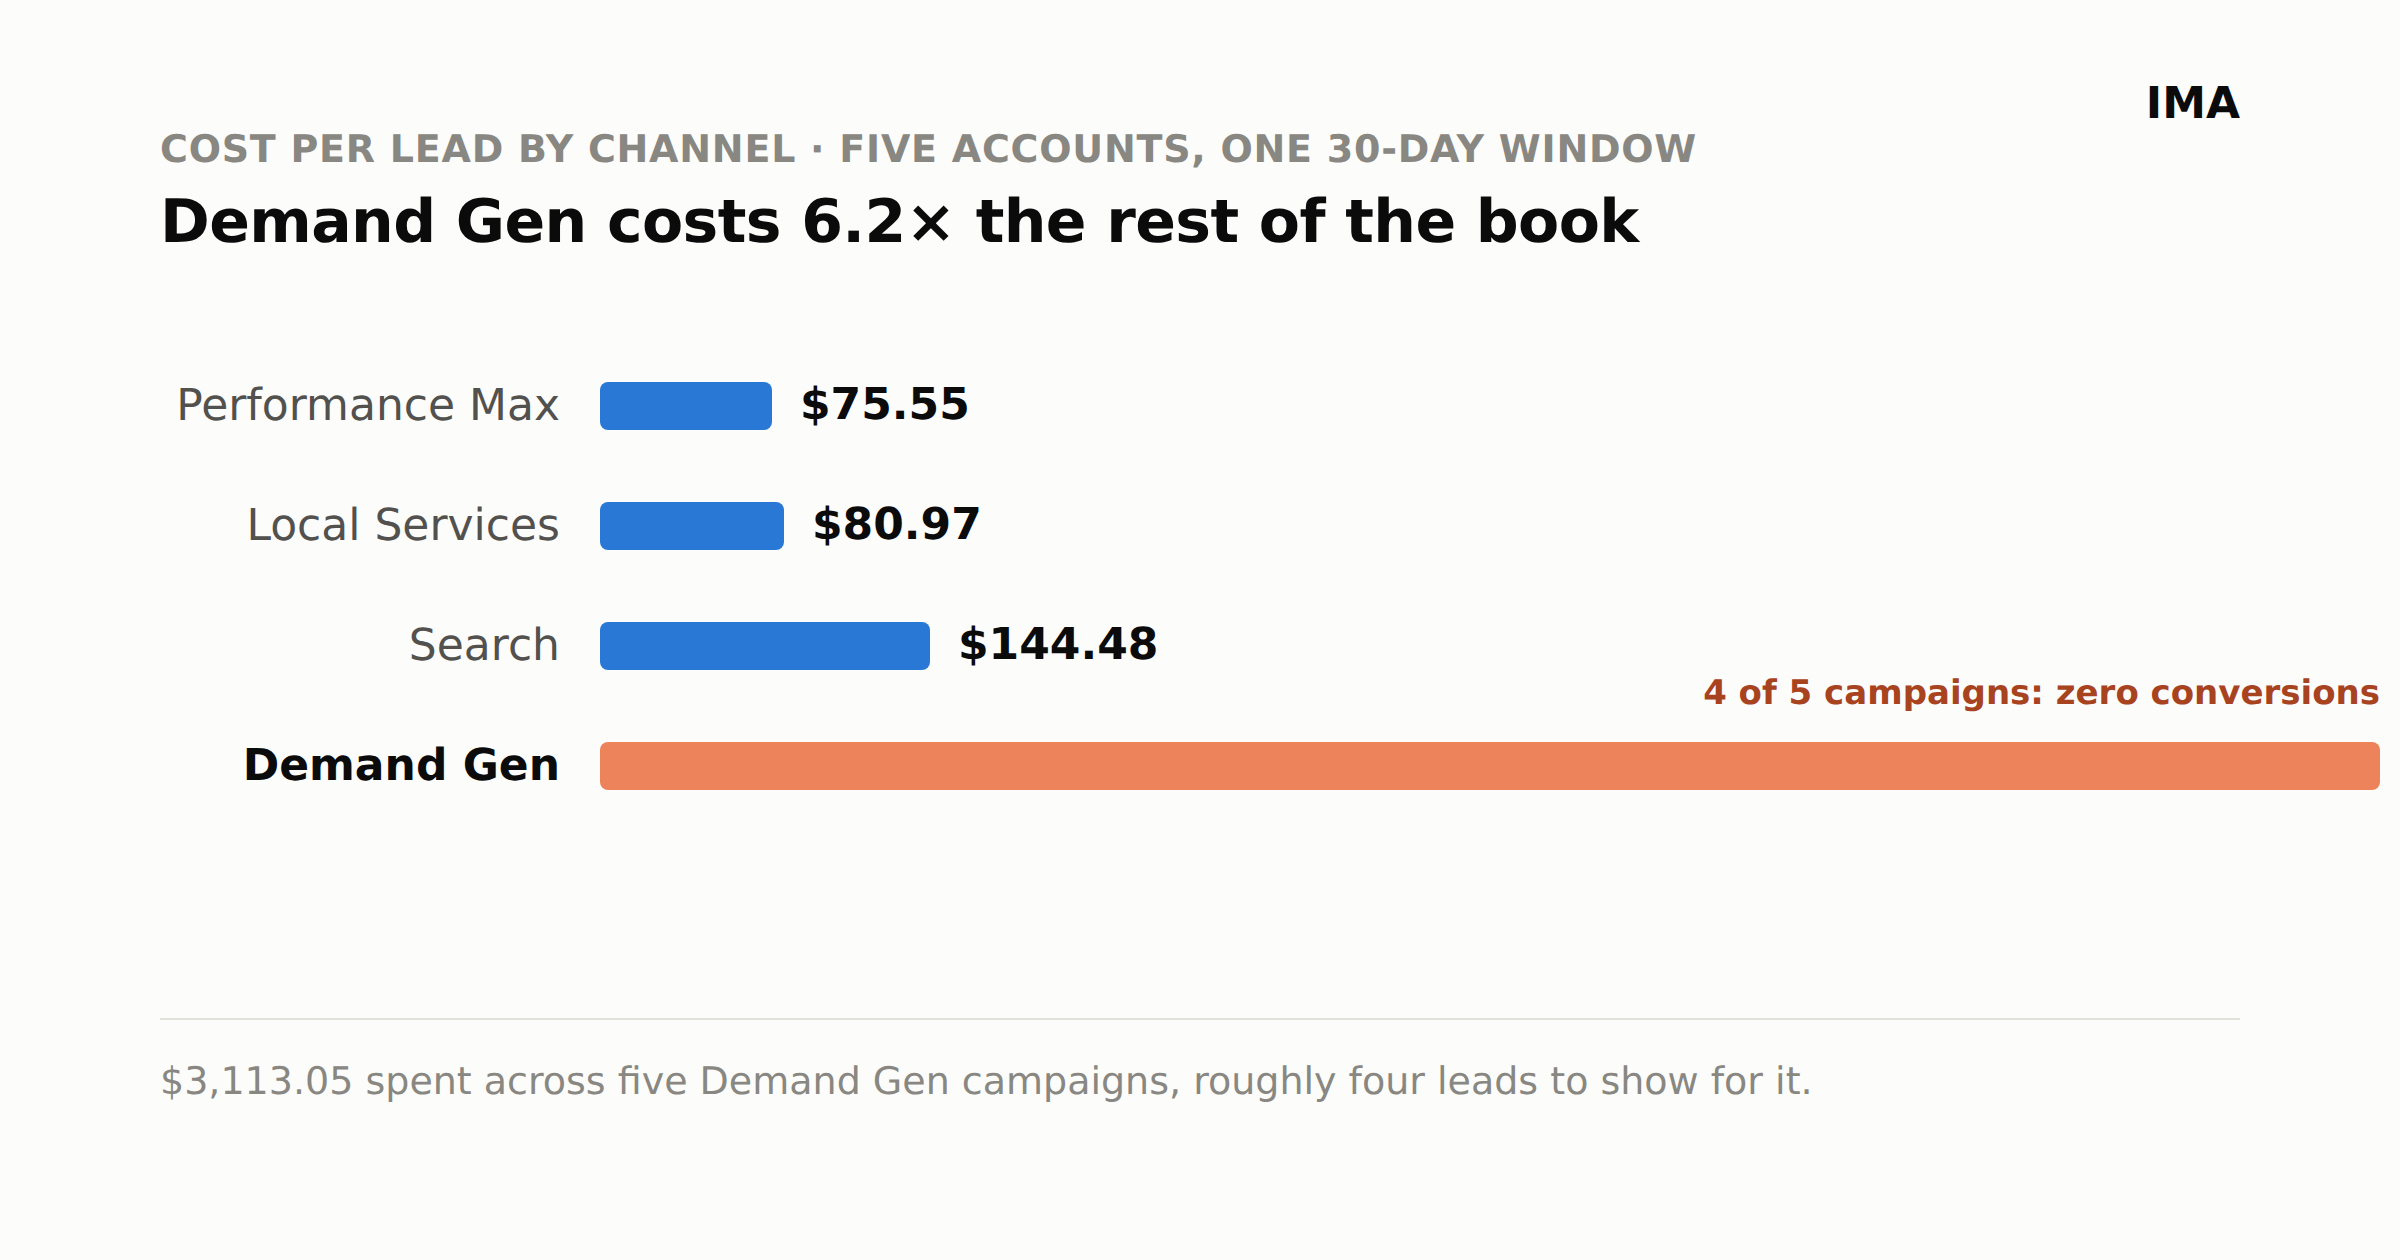
Five home-service accounts spent $3,113 on Google Demand Gen in 30 days and booked four leads. That is $779 per lead against a $125.70 book average.
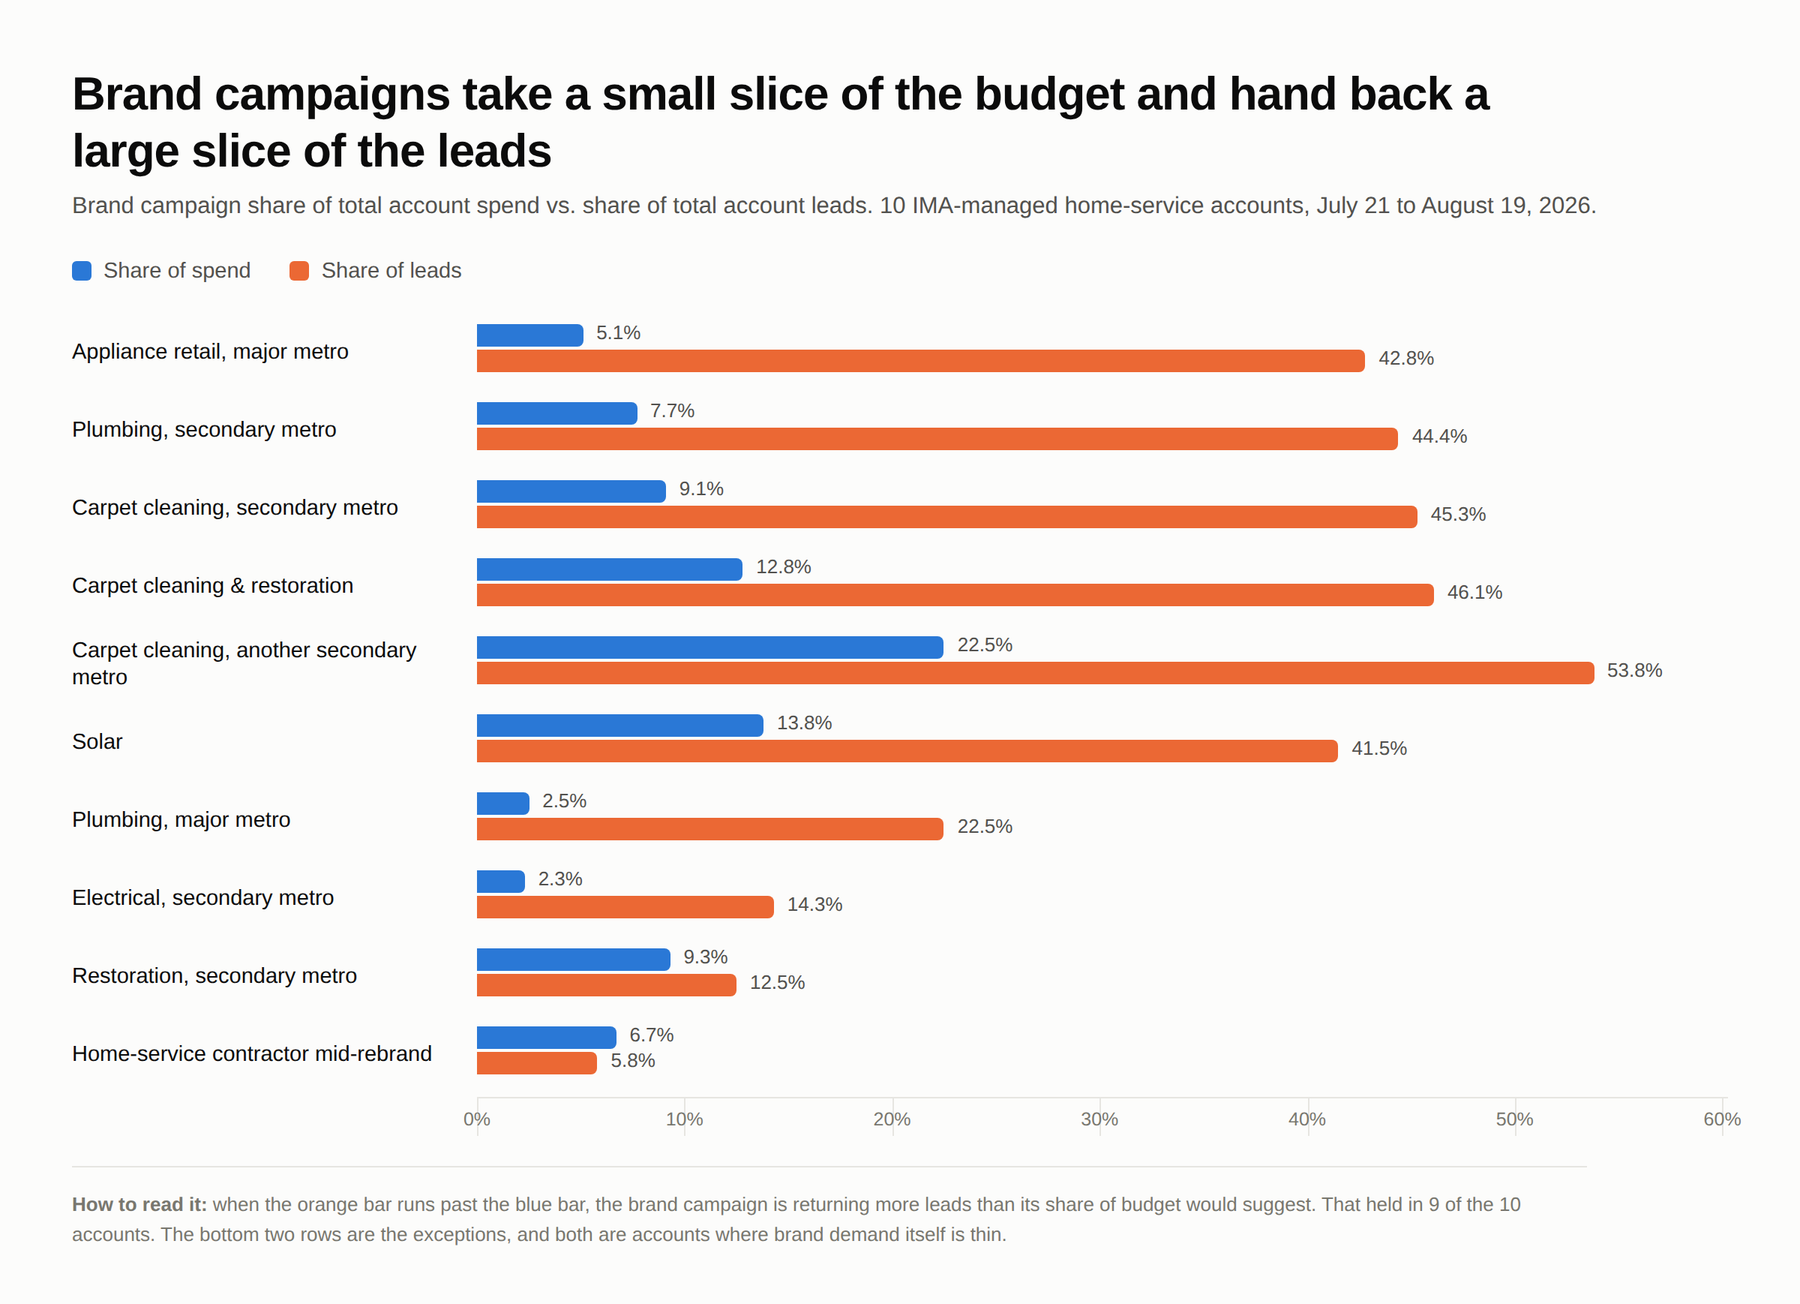
In one plumbing account spending almost six figures the brand campaign was 2.5% of spend and 22.5% of leads. We checked that pattern across 10 home-service accounts.
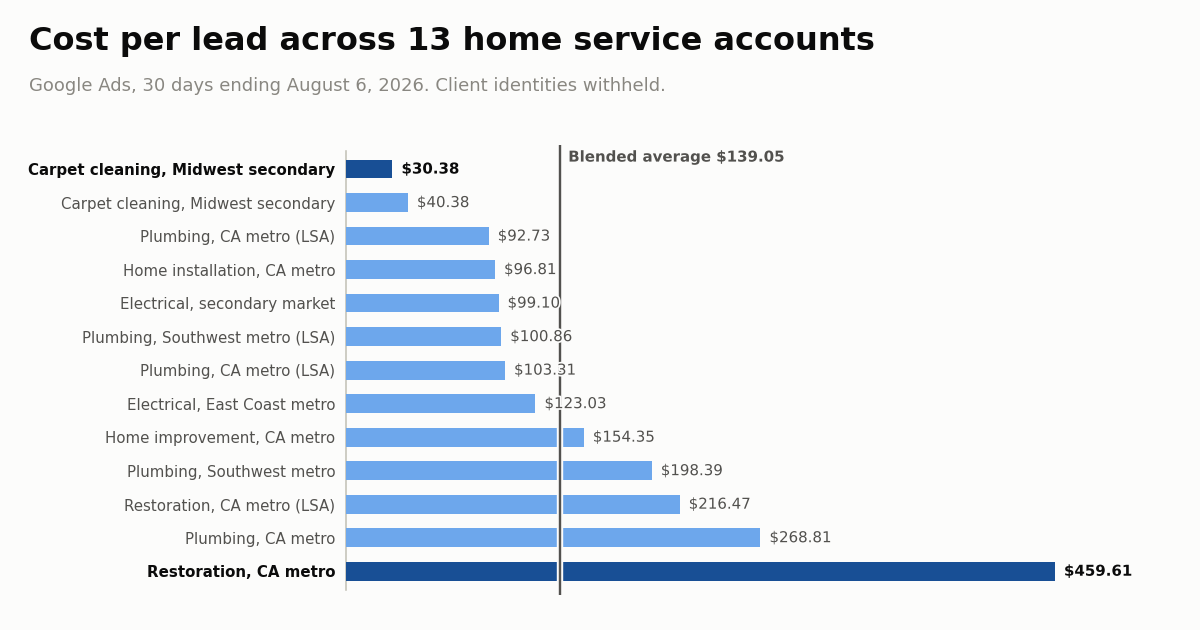
Across a sampling of Google Ads accounts, cost per lead ranged from $30.38 to $459.61 in 30 days, a 15x spread. Here is what actually drives it.Acos