
AI Ate 89% of Our Client's Blog Traffic. Revenue Per Click Went Up 165%.
AI cut blog traffic to a Bay Area plumbing client by 89%. Revenue per click still rose 165% once local and service pages picked up the slack.
March 23, 2021
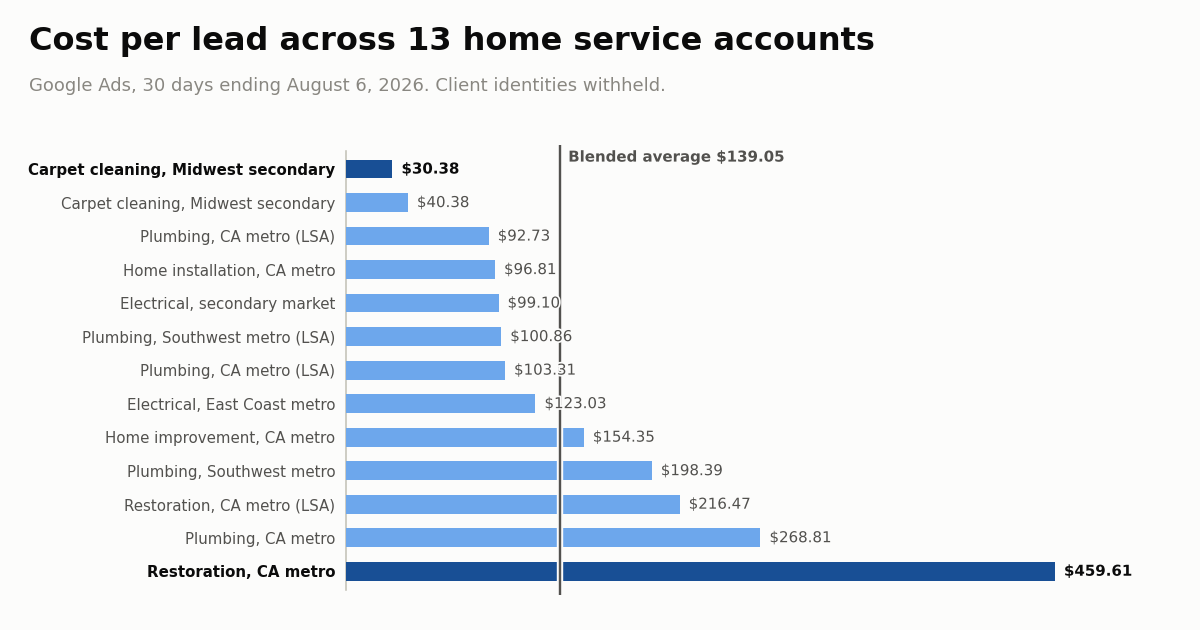
Across a sampling of Google Ads accounts, cost per lead ranged from $30.38 to $459.61 in 30 days, a 15x spread. Here is what actually drives it.Acos

Over the last 30 days, across a sampling of our home service accounts, this cohort spent $136,638 on Google Ads. The cheapest lead in the book cost $30.38. The most expensive cost $459.61.
That is a 15x spread. Same platform, same country, same basic buying motion: something breaks at home, somebody searches, somebody calls.
I pulled the numbers because I wanted to know how much of that spread is the market and how much of it is us.
A cross section of our home service accounts who are generating between $1M-$10M in ARR for the 30 days ending August 6, 2026.
Blended cost per lead across those 13 accounts: $139.05.
The median account came in at $103.31.
The gap between the median and the blend is the first thing worth noticing. When the average is 35% higher than the middle, a small number of expensive accounts are carrying a lot of weight.
Trades run from carpet cleaning to plumbing to restoration to electrical. Markets run from major metros to secondary Midwest cities.
Two things jump out of that list before we explain any of it.
The top of the list is carpet cleaning. The bottom is restoration. Nobody in the middle is close to either end.
Most people look at a table like that and conclude the expensive accounts are badly run. We're biased, but in our opinion that is not true. And getting this wrong is how owners end up cutting the campaigns that make them money.
Three things drive the spread, and only one of them is about account management.
A carpet cleaning job is a few hundred dollars. A water damage restoration job is several thousand, sometimes tens of thousands, and it is usually paid by an insurance carrier. Those two businesses cannot be compared on cost per lead and it is not close.
A $459 restoration lead can be dramatically better business than a $30 carpet cleaning lead. If one in three restoration leads becomes a $9,000 job, the effective cost of revenue is under 2%. No carpet cleaner in the country is running that math.
This is the part most people miss. Cost per lead is not a performance metric. It is an input. The metric is what you paid to acquire a dollar of revenue.
All accounts at IMA only count a phone call over 60 seconds as a lead. We also count form fills. Some have both, plus chat, plus a booked AI appointments. An account that counts four things will always show a lower cost per lead than an account that counts one, and the underlying business may be identical.
Look at the accounts running Local Services Ads in that list. They show conversion counts that are clean whole numbers, because Google Local Services counts a lead as a lead. The search accounts show fractional conversions like 287.99 and 89.99, because they are running attribution models that assign partial credit.
Some of this spread is waste, and it shows up in the same places every time.
Across five accounts in this analysis, Demand Gen campaigns spent $3,347.19 last month and produced 3 conversions. That is $1,115.73 per lead, eight times the blended rate for the book.
Four of those five campaigns produced zero conversions. Not expensive conversions. Zero.
We publish that because we are the ones who let it run. It is the single clearest line item in the audit and it is entirely defensible.
Brand campaigns took 4.9% of total spend and produced 28.8% of total conversions, at $23.53 per lead against $185.73 for everything else. That is a 7.9x gap.
Almost every account here runs brand. The ones near the top of the distribution run proportionally more of it. Which means part of what looks like efficiency in the cheap accounts is really just a higher share of people who already knew the company name.
And how do you generate a higher share of popel who already know the company name? By running Demand Gen campaigns that don't pay off today but will pay off in the future. There is no free lunch. You can't skip steps. You have to put in the work.
That is not cheating. Brand traffic is real demand and defending it is correct. But if you are benchmarking two accounts against each other and one has three times the brand share, you are not measuring the same thing.
Here is where this finding breaks, and I would rather say it than have somebody else say it.
A 15x spread sounds damning and mostly is not. Strip out the job-value differences and the conversion-counting differences and the honest gap between the highest CPL and lowest CPL is a lot closer to 2x than 15x.
The single most expensive account in the list spent $1,378.84 and recorded 3 conversions. Three. At that volume, one additional lead moves the cost per lead by more than $100. I would not make a budget decision on 3 conversions and neither should you. The number is real and it is also close to meaningless on its own.
Same problem at the cheap end. One account recorded a conversion count with a decimal in it because the attribution model split credit across touchpoints. Reasonable people configure that differently.
If somebody publishes a cross-account benchmark and does not tell you the sample size per account, the conversion definitions, and the job values behind it, they are selling you something.
If you run a similar type of businesses, four things are worth an hour of your time as you prep for your next agency meeting.
Find your real number. Not cost per lead. Cost per acquired dollar of revenue. Take last month ad spend, divide it by the revenue that closed from leads that came in that month. If you cannot do that calculation, that is the actual finding, and it is more urgent than whatever your cost per lead is.
Write down what you are counting. Open your conversion actions and list every one marked as primary. Most owners are surprised. If a 15-second call is in there, your cost per lead is fiction.
Check what your non-search campaigns produced. Pull up any Demand Gen, Display, or video campaign and look at conversions, not impressions or clicks. If the answer is zero over 30 days, you take that into consideration when doing the CPL math.
Look at what is not spending. Sort your campaigns by cost and read from the bottom. Anything at zero is either quietly broken or demand gen, and the difference matters a lot.
None of that requires hiring anybody. It requires about an hour and a willingness to be annoyed by what you find.
The 15x spread in this book is mostly a story about different businesses being different.
Most owners never look. That is the whole advantage.
Figures are from IMA-managed Google Ads accounts for the 30 days ending August 6, 2026. Client identities are withheld; accounts are described by trade and market size only. Cost per lead is calculated as total cost divided by total conversions per account, not from the Google reported cost-per-conversion field.
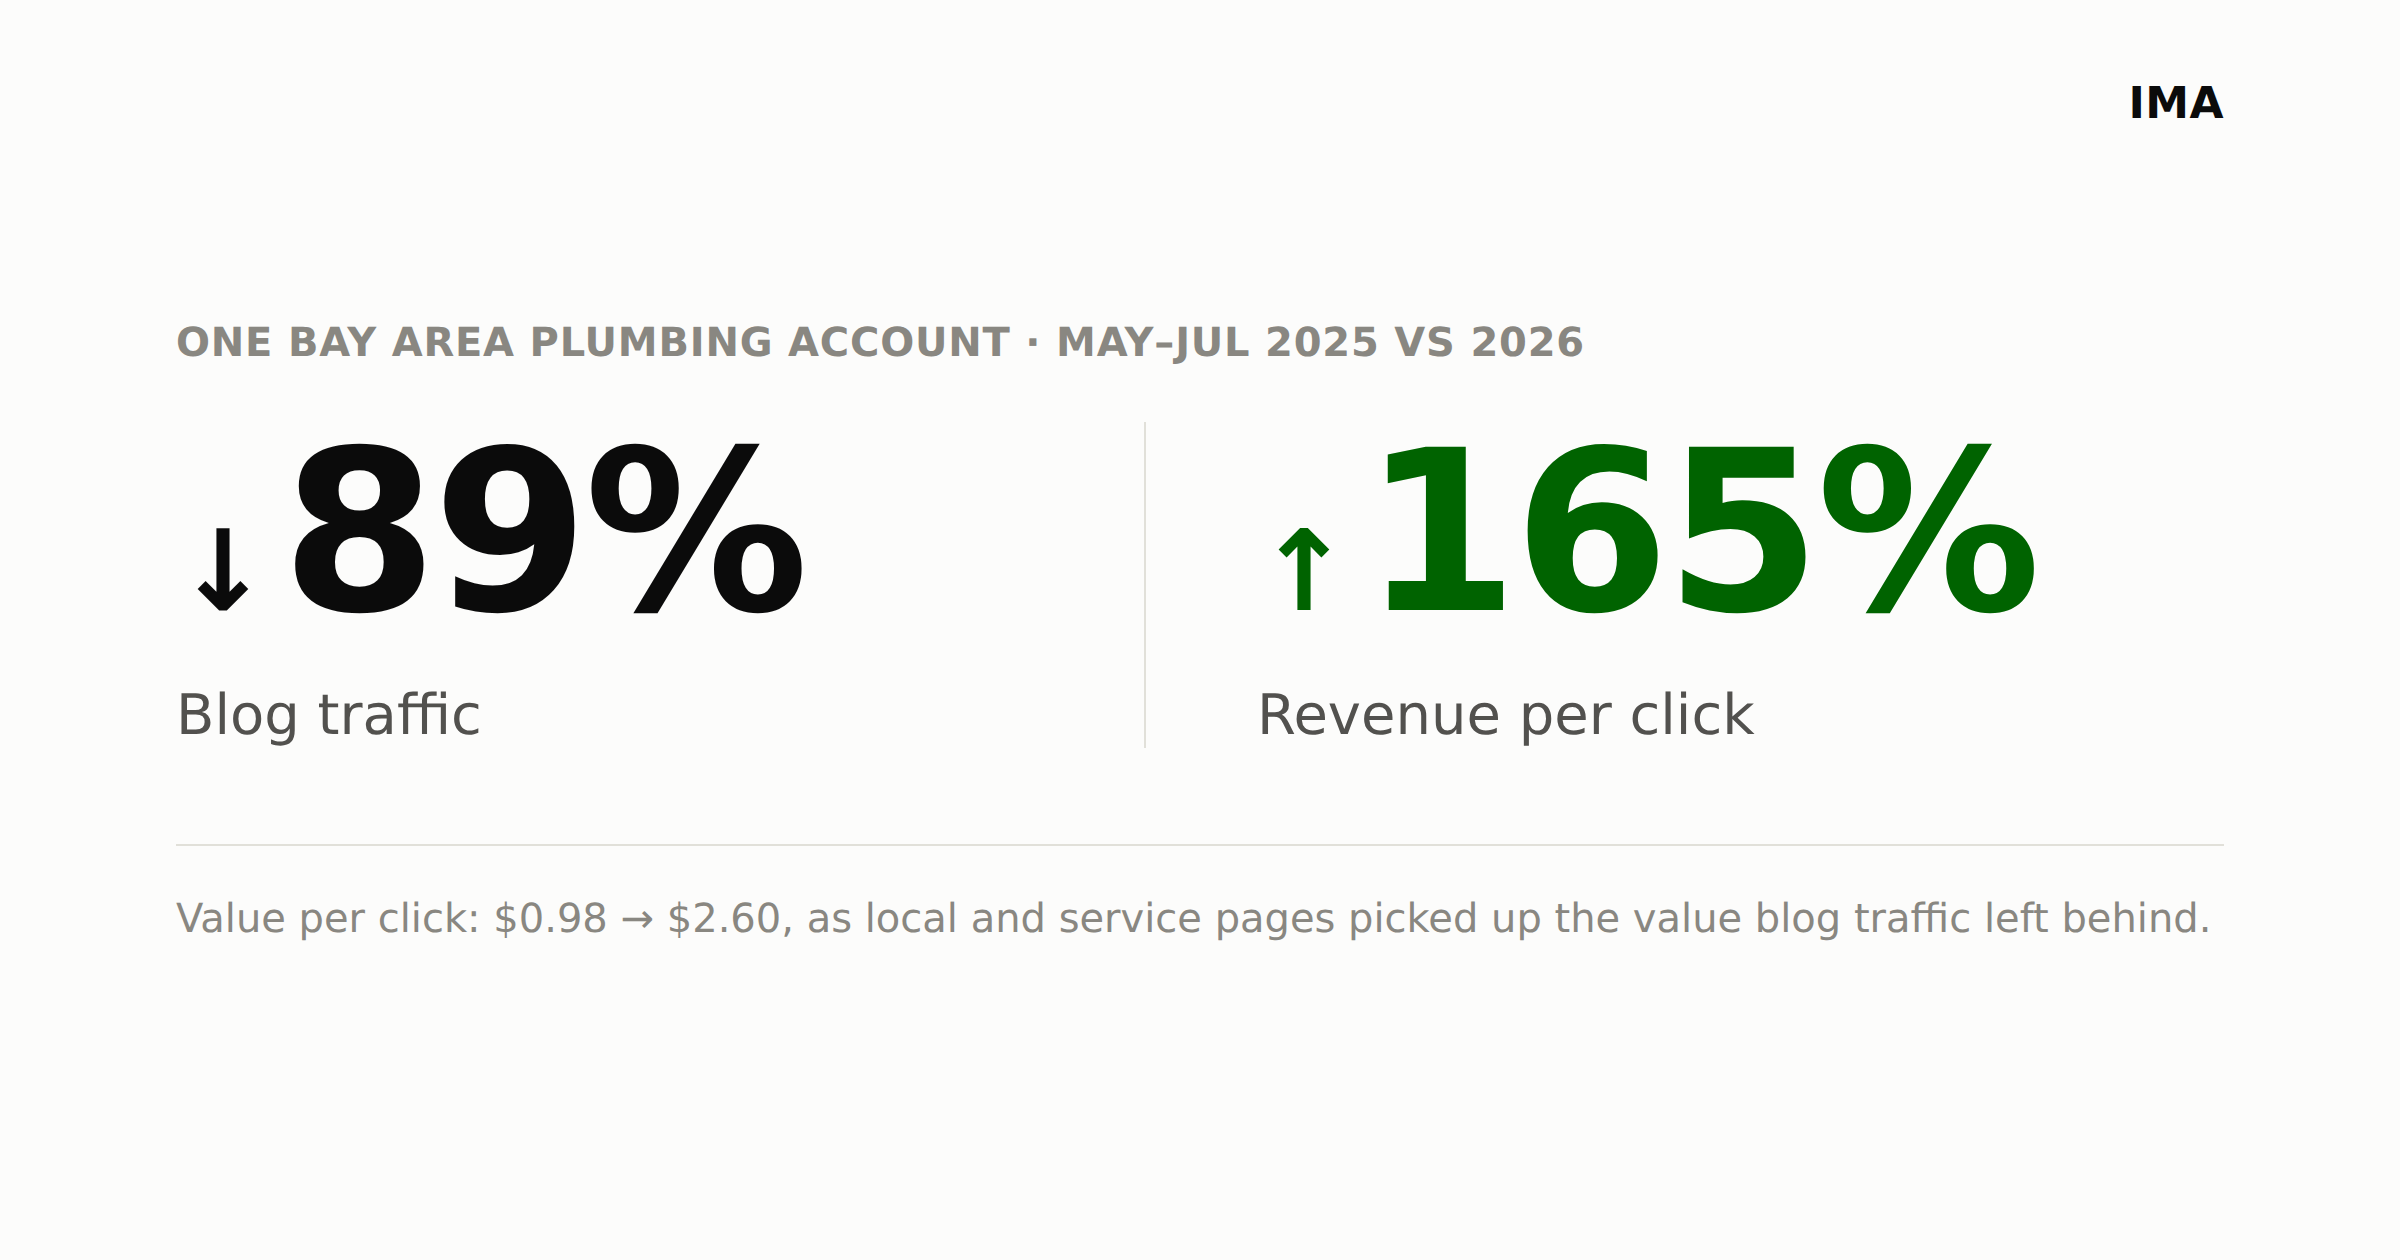
AI cut blog traffic to a Bay Area plumbing client by 89%. Revenue per click still rose 165% once local and service pages picked up the slack.
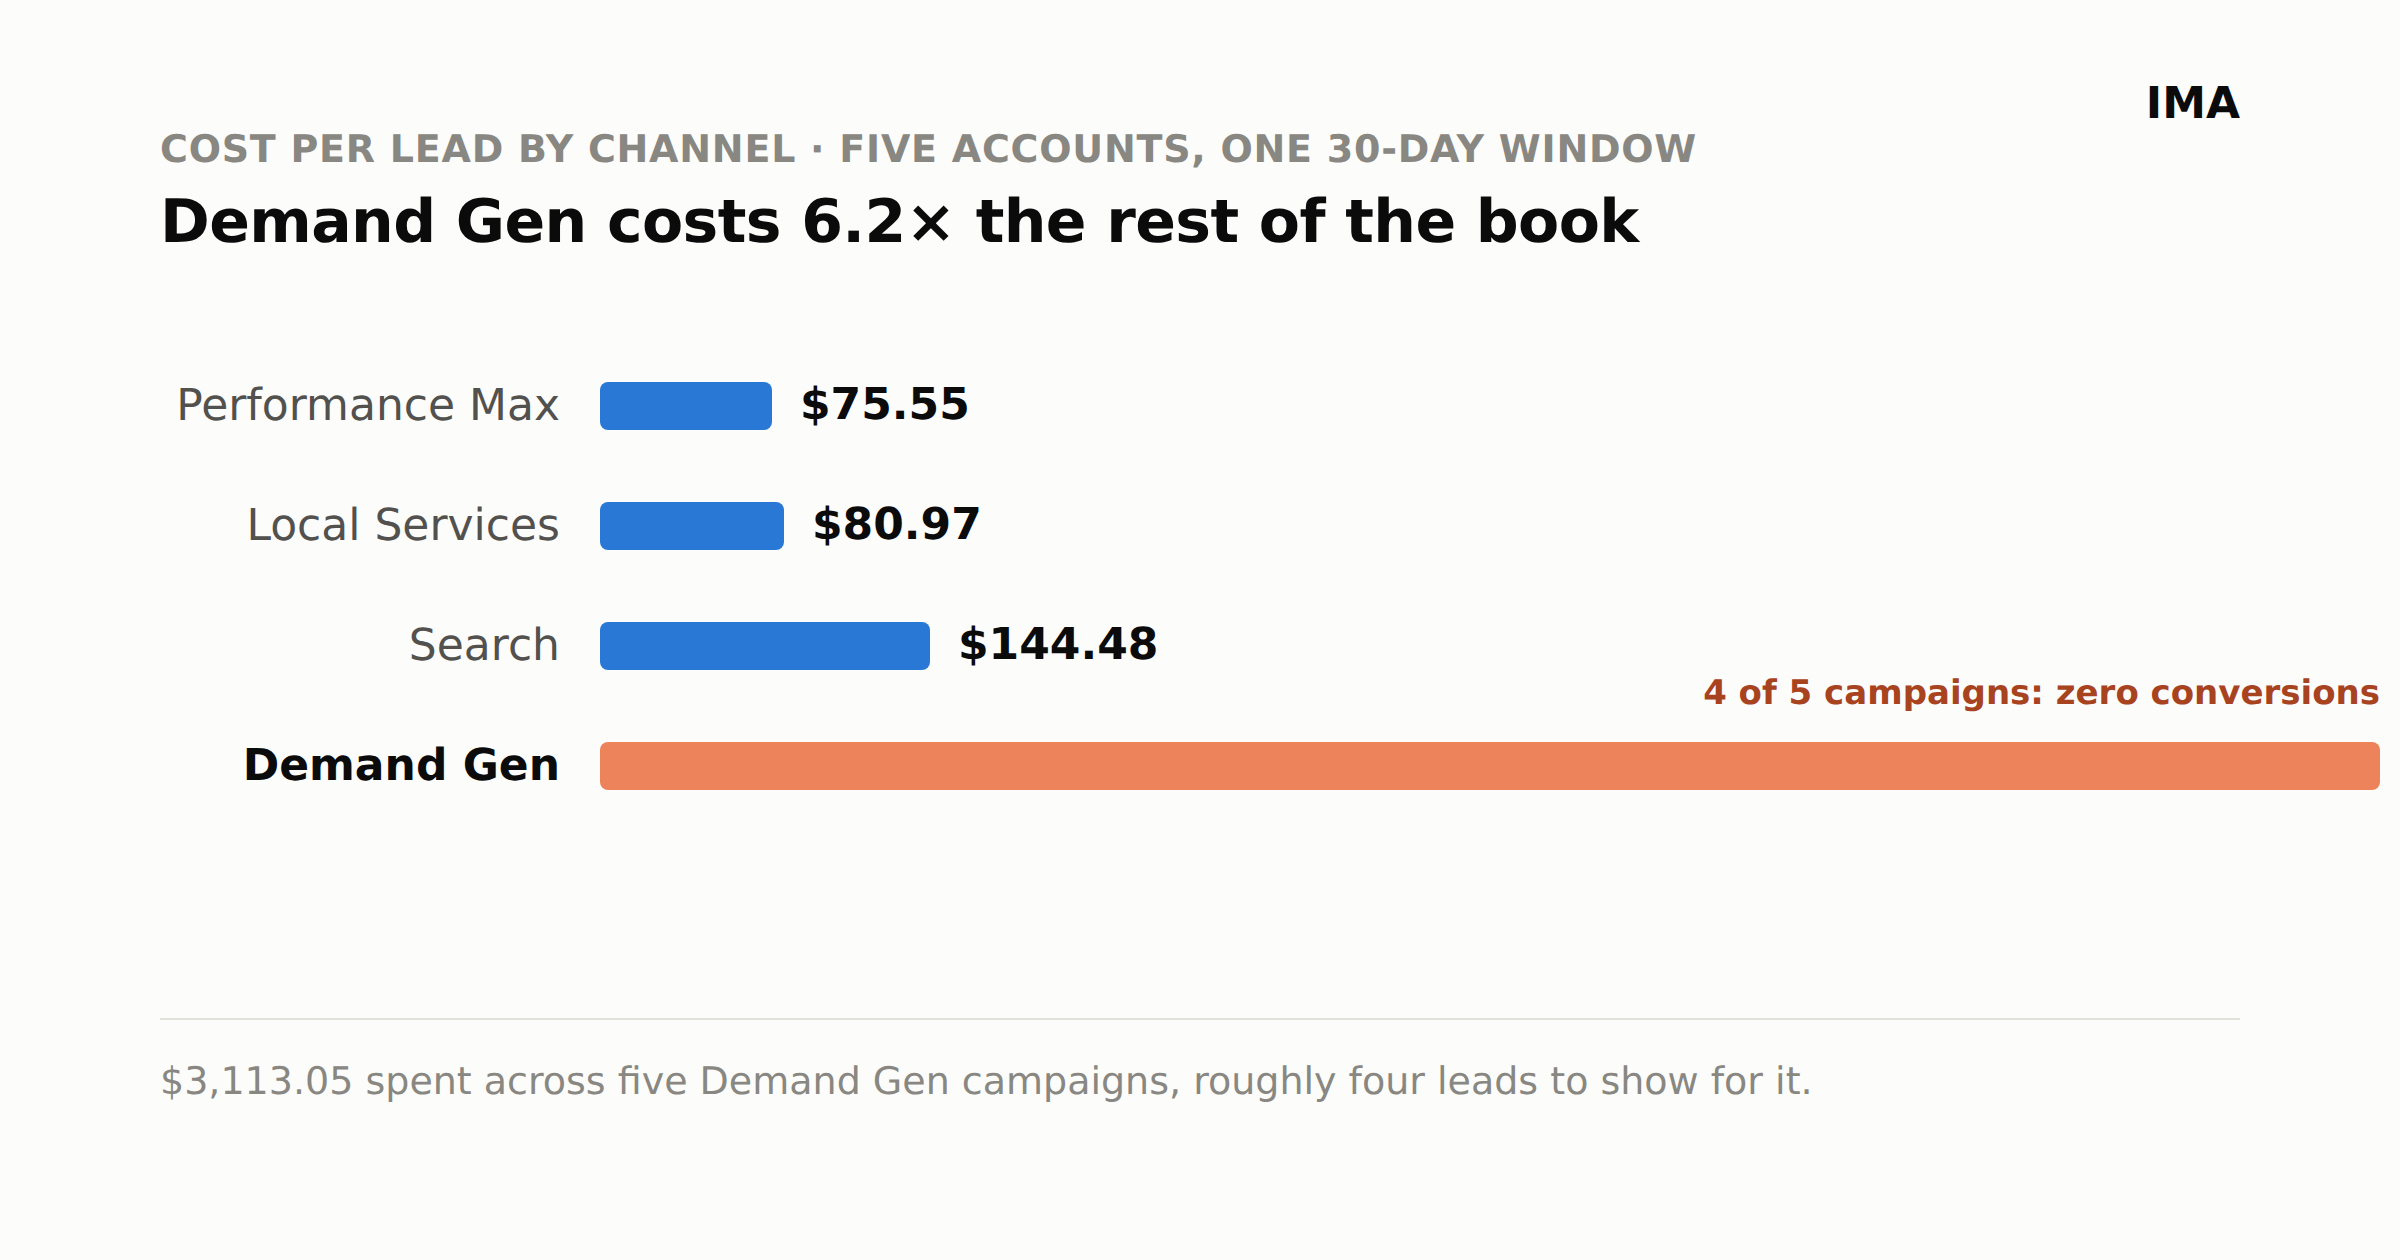
Five home-service accounts spent $3,113 on Google Demand Gen in 30 days and booked four leads. That is $779 per lead against a $125.70 book average.
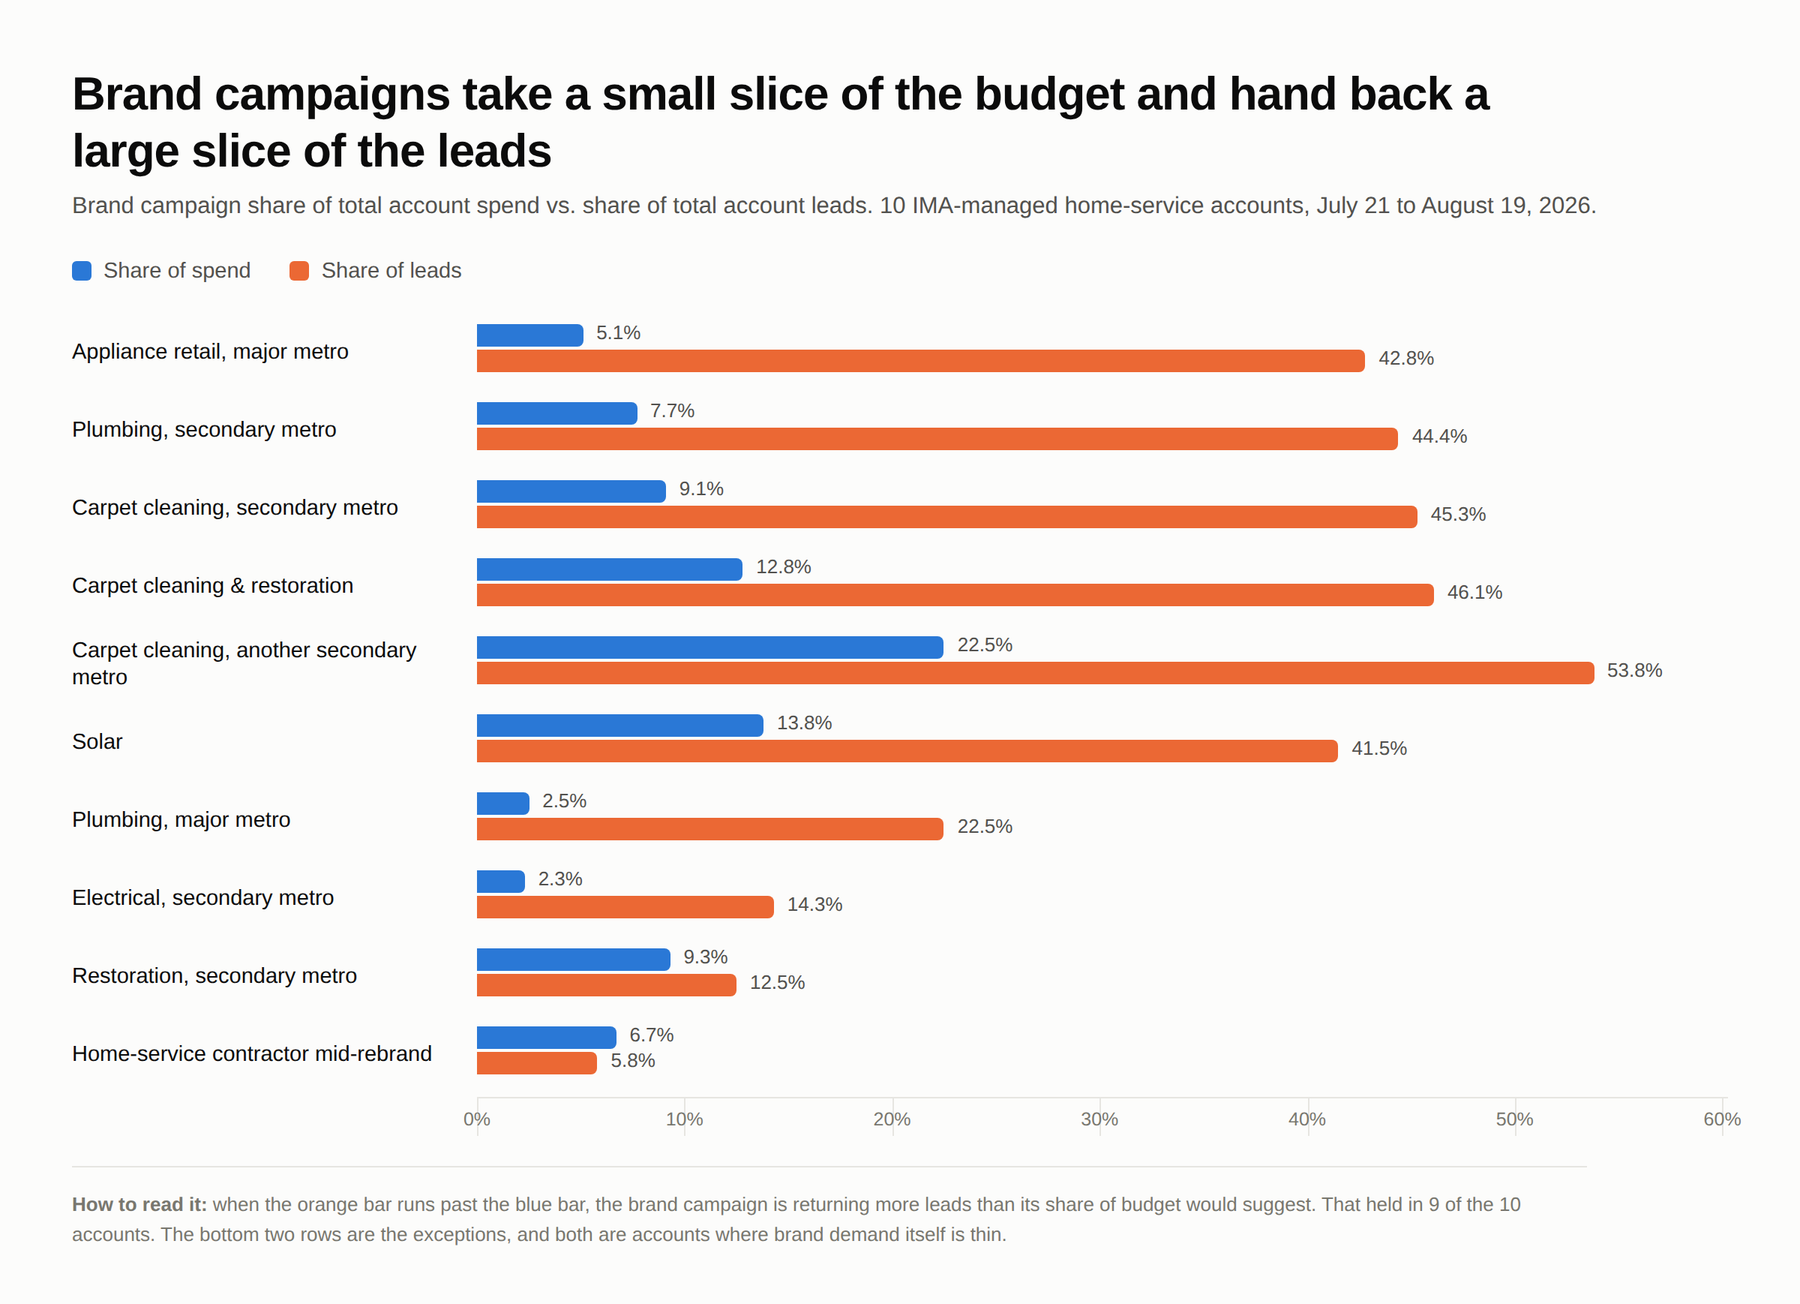
In one plumbing account spending almost six figures the brand campaign was 2.5% of spend and 22.5% of leads. We checked that pattern across 10 home-service accounts.